Lighthouse is a free website quality auditing tool that you may already have installed on your laptop (and likely didn’t know it was there!) Let me give you a super short non-technical overview of what it is, how to use it, and how it can help put money in your pocket.
Speed Matters
In short, website quality and performance has a direct impact on revenue. Faster pages translate to better search engine rankings, better user retention, and fewer bounced (or annoyed) visitors. There is a ton of data that makes it clear that people will not stick around waiting for your site or application to load for more than a second or two.
If you own a website or web-based application, you need to pay close attention to a handful of critical metrics related to performance, accessibility, best practices, and SEO. The experience that these metrics measure matters to your users. Just as important, Google is also aware of these metrics and is less likely to direct new visitors to your web-application if it scores poorly.
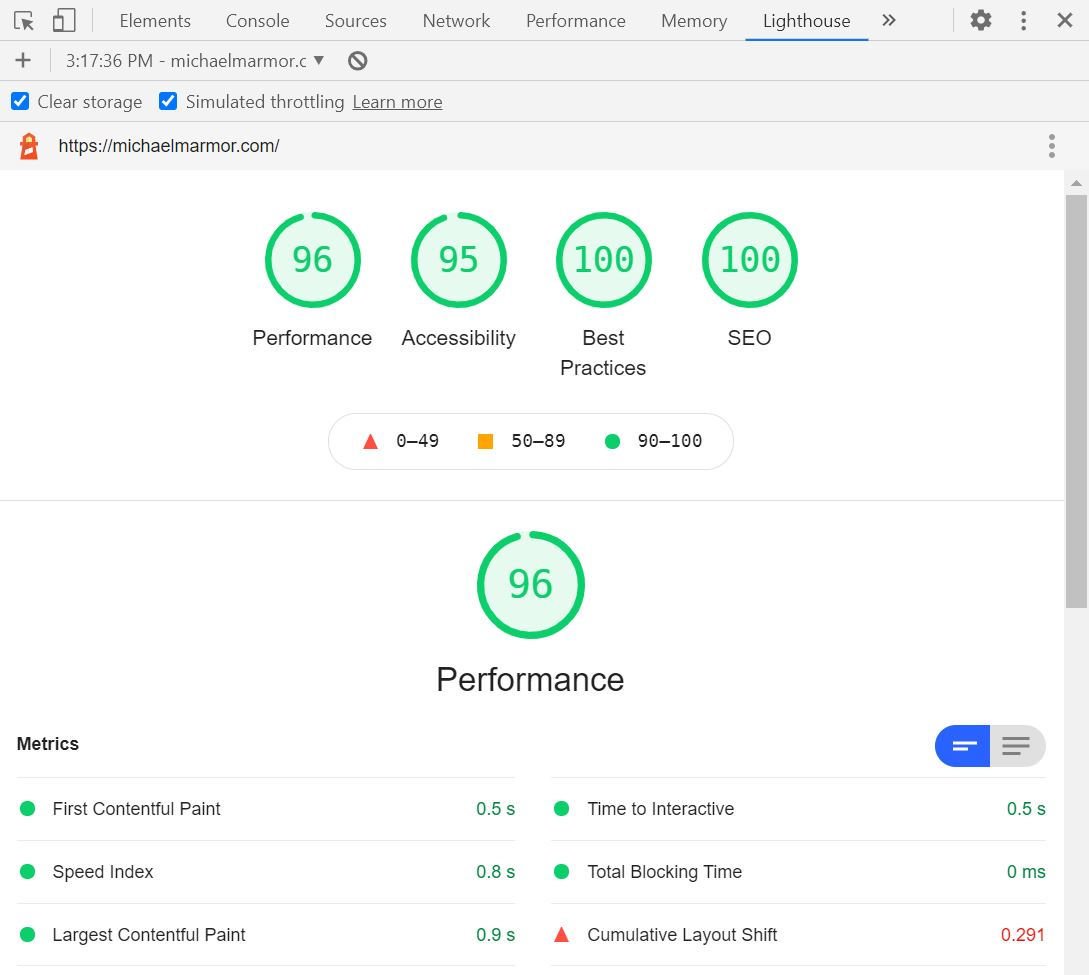
Luckily, there is a free and open-source tool to help you gather these metrics and advise you of best practices. The tool is called Lighthouse, and it is part of the Google Chrome web browser. In a minute, I’m going to show you how to use Lighthouse to generate these critical performance metrics yourself for any website.
For Entrepreneurs and Developers
As a consulting CTO, I frequently work with non-technical founders building software-as-a-service web apps. I always encourage these clients to get familiar with Lighthouse and the metrics and insights it generates. These metrics can help entrepreneurs communicate with their technical teams and establish measurable quality baselines that teams need to meet and maintain. That last bit is worth repeating: Lighthouse gives you fantastic visibility into your website’s technical performance and gives you the technical terms and quantitative metrics to communicate issues effectively to your development team! When your team says they have fixed a metric-related problem, you can use Lighthouse yourself and confirm the improvements they made. That makes Lighthouse a powerful management and communication tool and one you should know how to use even if you never touch the code of your web app.
Try it Now: 1-Minute Tutorial
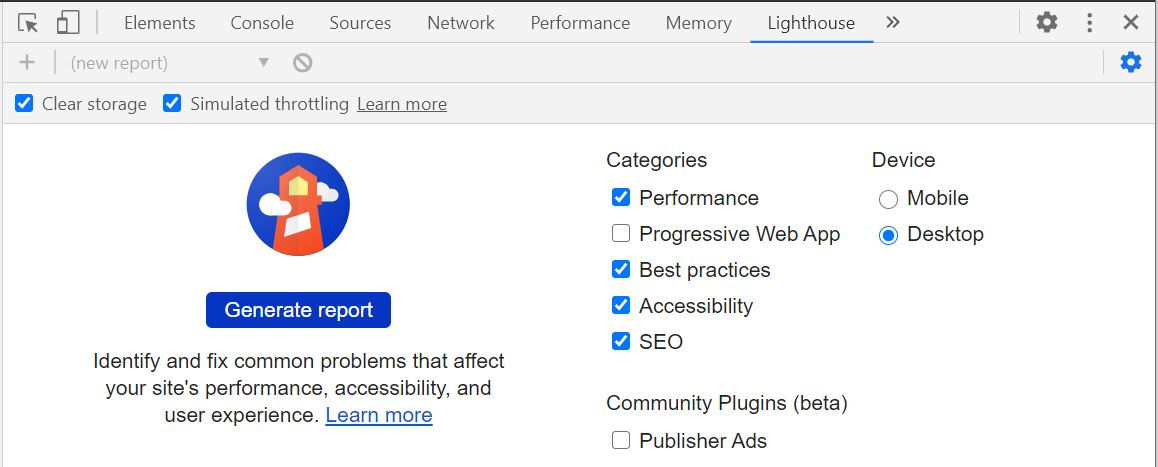
You can run Lighthouse against any web page, including any public website or private app, even if it requires authentication. Lighthouse automatically audits pages for performance, accessibility, SEO, best practices, and more, and provides easy to understand quantitative reports. When you give Lighthouse a URL to audit, it runs a bunch of tests against the page, and then it creates a report with scores on how well the page did. Failing audits provide additional information that your technical team will find meaningful, including specific advice on improving the score.
If you have the Google Chrome browser installed on your computer, give this a quick try:
- Open the Chrome web browser and navigate to a webpage that you want to audit. Consider using an incognito window, which may reduce the number of chrome extensions running and interfering with audit results.
- Open Chrome DevTools with
Command+Option+C(Mac) orControl+Shift+C(Windows, Linux, Chrome OS) - Select
Lighthousefrom the right side of the top panel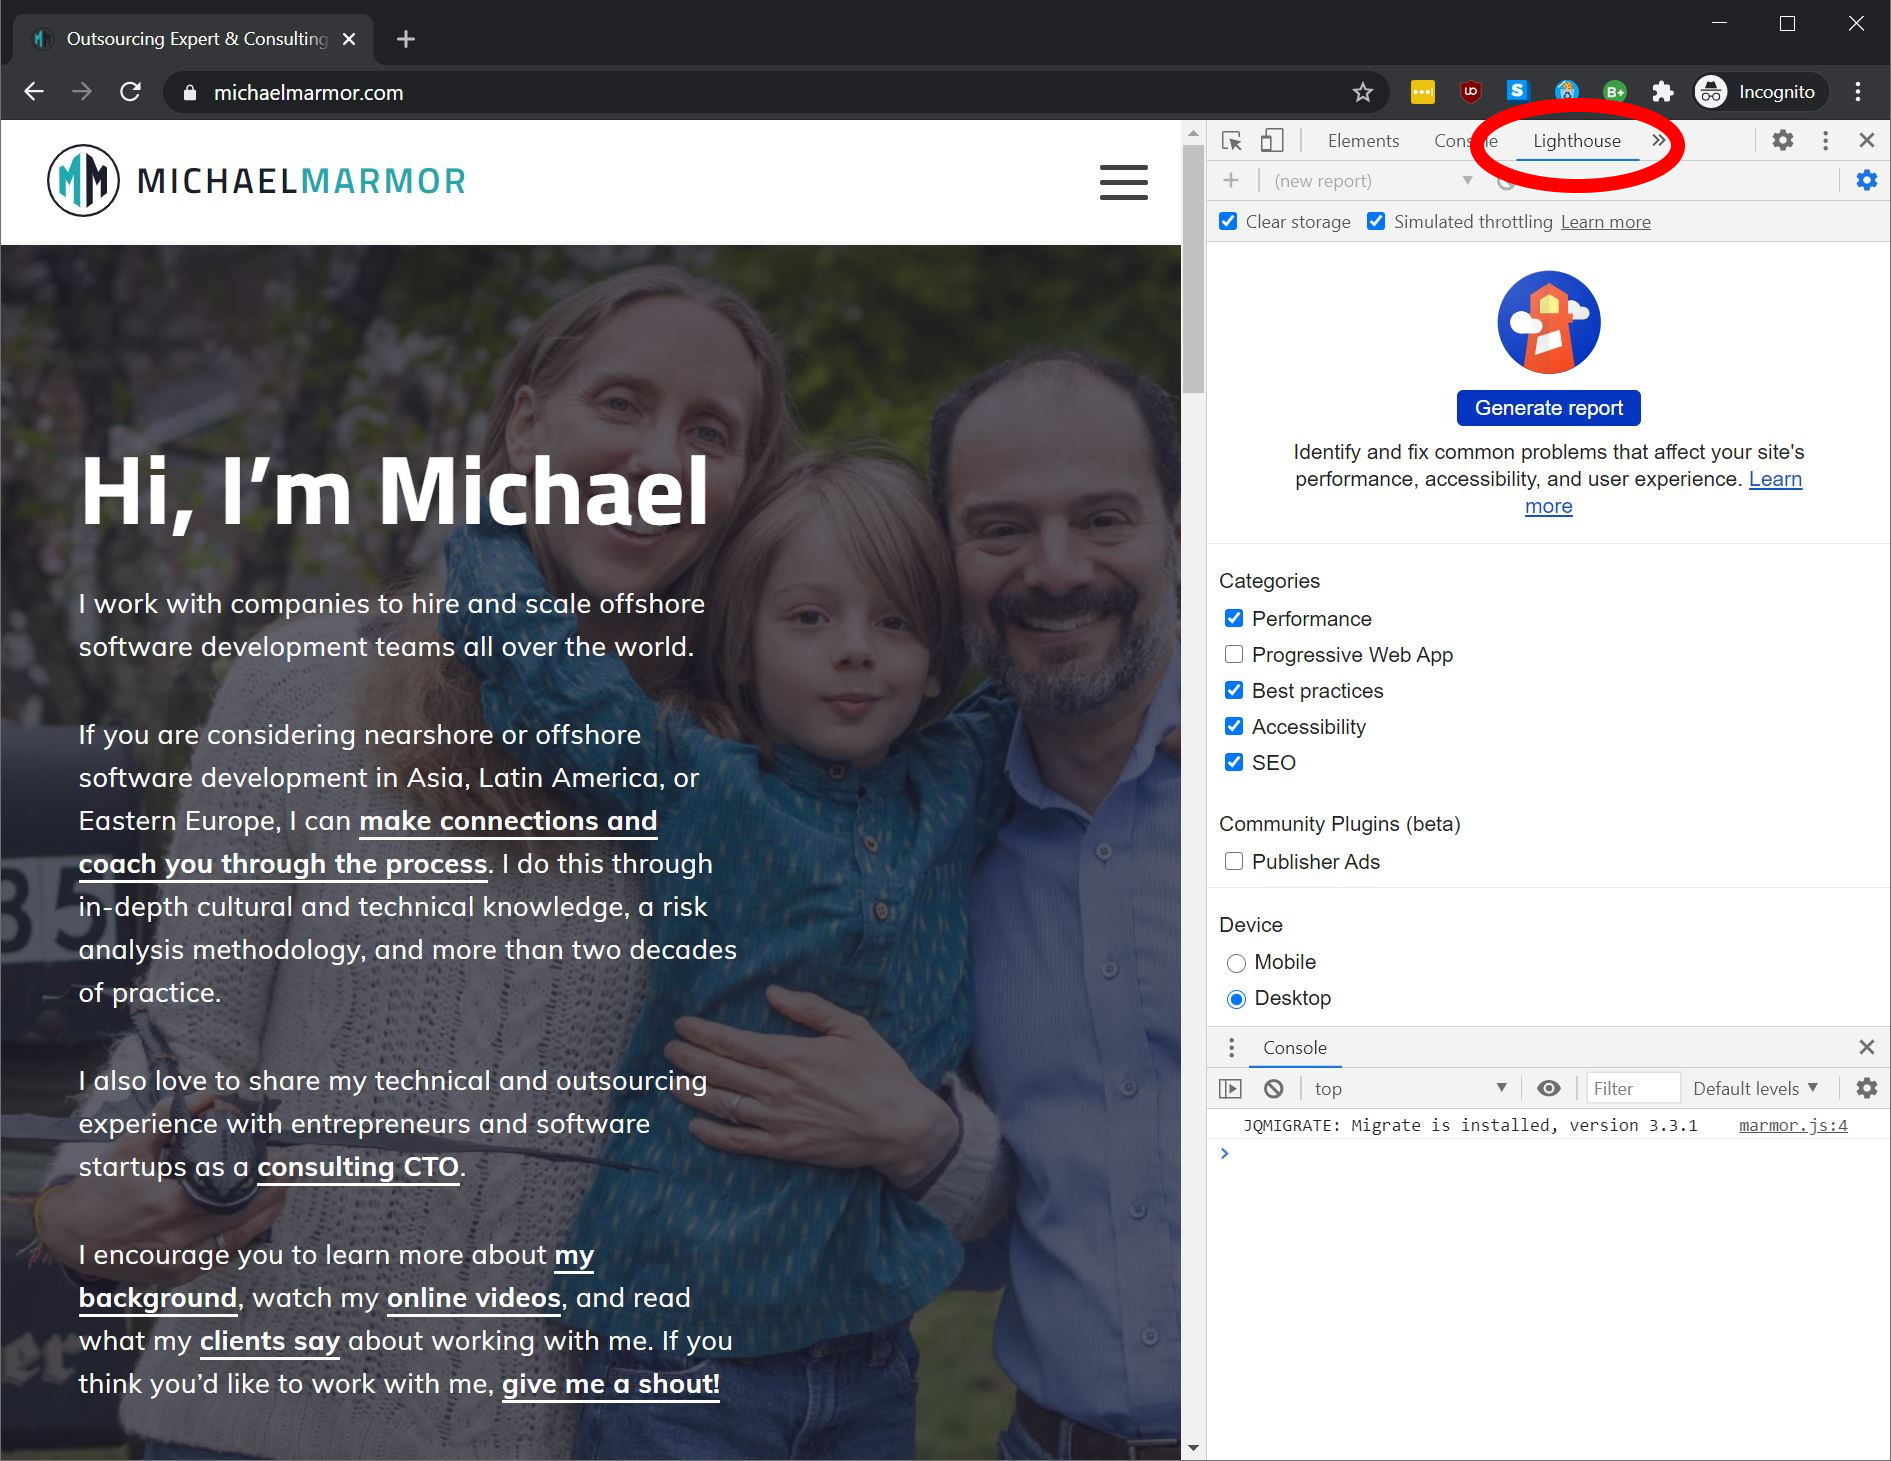
- Select either
MobileorDesktopto run the audit as if the site visitor was using that type of device. - Select the categories such as
Performance,Best practices, andSEOthat you would like to audit. I generally run the audit for all categories but only selectProgressive Web Appif the page is an actual web-application. There is no harm in simply selecting everything. - Click
Generate reportand wait for the software to run and create the report. - Look at the scores. Don’t Panic! (And know that only you can see these results, they are private to you.)
What Does this Mean?
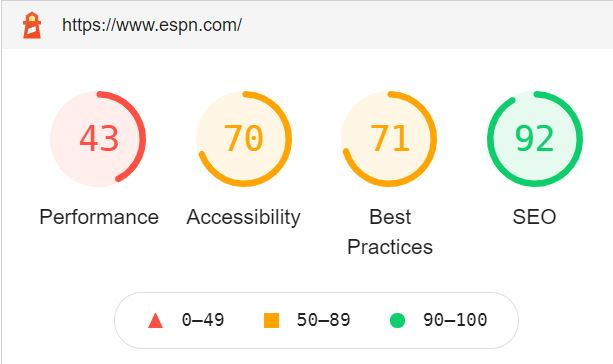
If you get a low score, take a deep breath, and don’t panic. A low score does not necessarily mean that your website sucks, that your development team is incompetent, or you have gaping security vulnerabilities. These scores are not a proxy for your software development quality, but they can indicate “level of polish” and attention to detail.
The purpose of this article is to get you familiar with Lighthouse at a high-level and get you focused on the metrics that it creates for you. I’m not going to describe what each metric is or its relative importance, but I will point you in the right direction below. Please reach out to me if you want to discuss your Lighthouse results in detail. Seriously. Give me a shout—that’s why I’m writing this article. I help my clients avoid common mistakes, reduce risk, and achieve better engineering and financial outcomes from their software developers.
If you want to dive a bit deeper into Lighthouse, here are the six metrics used “under the hood” to make up the Performance score (in the now current Lighthouse version 6). There is a lot more to learn, but this is an excellent place to start:
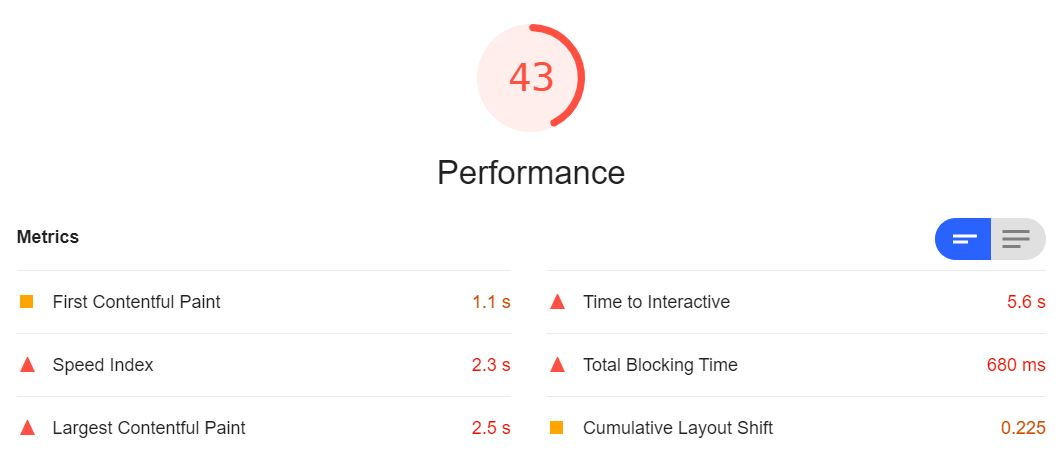
- First Contentful Paint (weighted 15%)
- Speed Index (weighted 15%)
- Largest Contentful Paint (weighted 25%)
- Time to Interactive (weighted 15%)
- Total Blocking Time (weighted 25%)
- Cumulative Layout Shift (weighted 5%)
VIDEO: 2-Minute Security Checks
If you have not seen it yet, check out my video and article 2-Minute Website Security Checks. This video shows you two dead-simple online tests that will give you a bit of insight into your website’s security configuration.
